Semantics-Aware Explainable Machine Learning for Urban Service Demand Forecasting in Smart Cities
An interactive dashboard for visualizing the SIMC NYC research paper. This tool helps partners, reviewers, and supervisors understand the spatiotemporal-semantic early-warning formulation for NYC urban service demand forecasting without reading the full paper first.
Key Numbers
Scale of the NYC urban service demand forecasting dataset
Research Questions
Three core questions driving this research
Can a leakage-safe multi-source panel forecast next-week abnormal reported demand under a future chronological test?
Do semantic service categories benefit from category-specific alert thresholds?
Which temporal and urban-context feature groups drive predictions?
Key Contributions
What this research brings to urban service demand forecasting
Early-Warning Formulation
Spatiotemporal-semantic early-warning system for abnormal demand detection
Multi-Source Panel
NYC 311 + NOAA + OSM + PLUTO data integration
Chronological Evaluation
Target-week chronological evaluation with leakage-safe splits
SHAP Interpretation
Model explainability through SHAP-based feature importance analysis
Method Pipeline
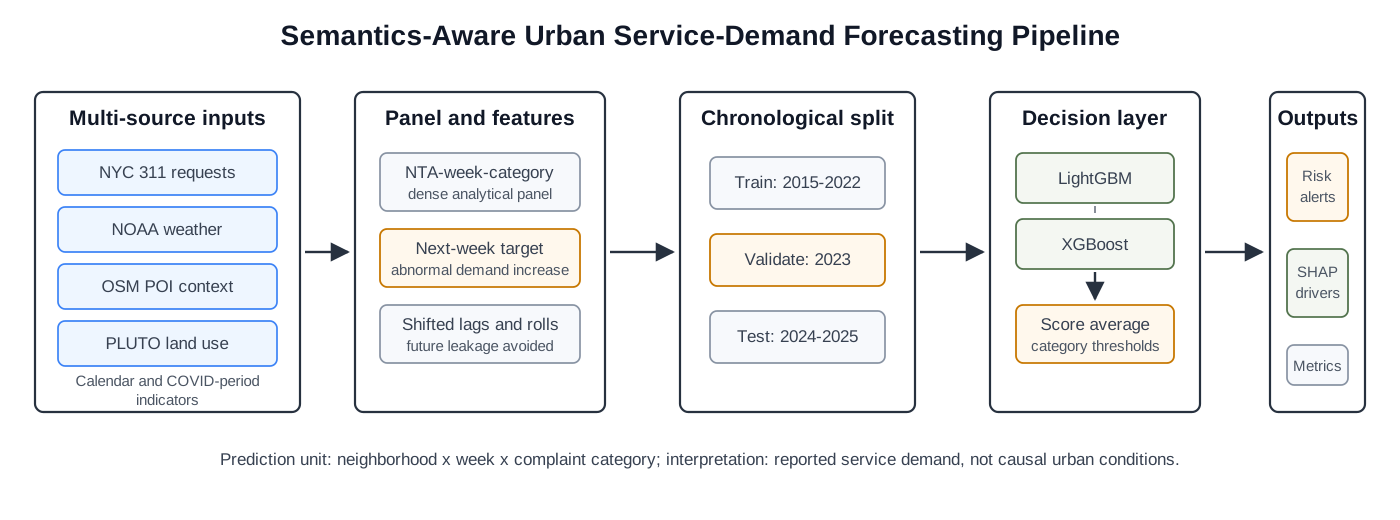
Data sources → feature engineering → model training → evaluation → explainability
Model Performance Snapshot
Test set results for the selected ensemble model
Explore the Dashboard
Navigate to different sections for deeper analysis